Training Overview
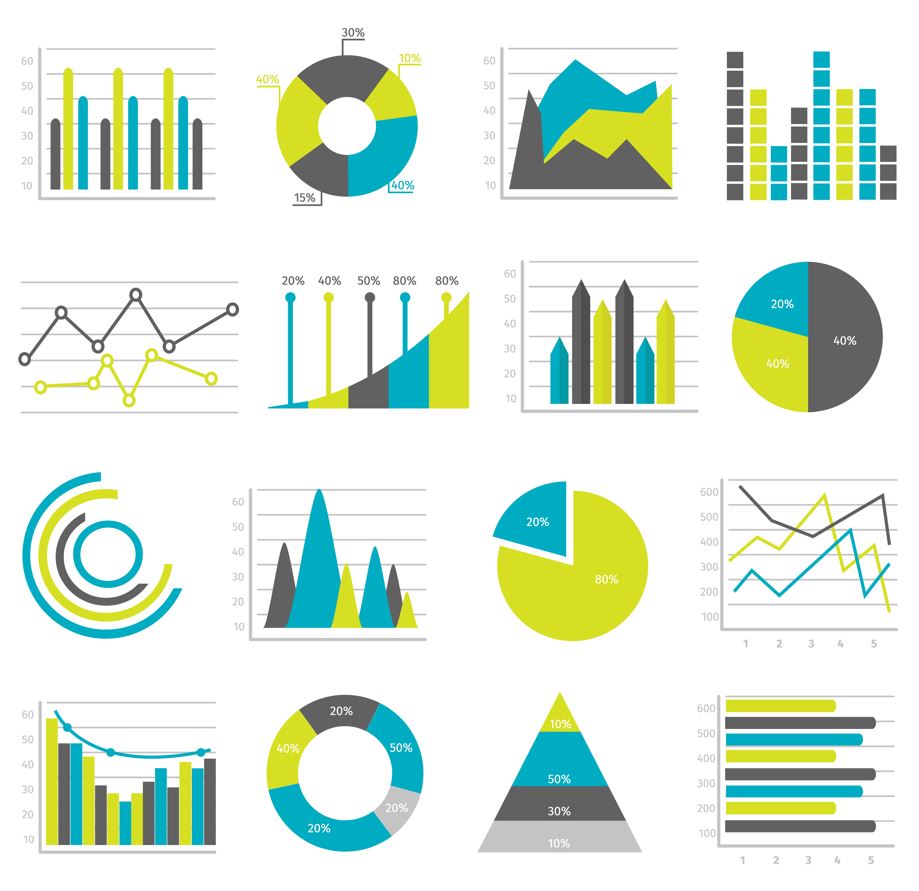
This training provides the overview about the variety of Graphical Methods for depicting data. Graphical methods are quite appealing because they provide an instant representation of the data while giving the viewer an almost complete understanding with little room for misinterpretation.
Training Benefits
- Understand plotting of different Graphs
- Uses of different Graphs
- Construction and Interpretation of different Graphs
- How to Draw Conclusions about the Data from the Graphs
- Plot the Graphs using Minitab
Training Methodology
- Presentation
- Interactive Session
- Q&A Session
- Written Examination
Training Content
- Histogram
- Boxplot
- Bar Chart
- Pie Chart
- Dot Plot
- Scatterplot
- Individual Value Plot
- Stem and Leaf Diagram
- Time Series Plot
- Normal Probability Plot
Who Should Attend
- Managers, Executives, Engineers and Other Staff
- Students or any Professionals requiring an overview of Graphical Methods

